SKU/Artículo: AMZ-9355515383
Data Visualization with Python: Exploring Matplotlib, Seaborn, and Bokeh for Interactive Visualizations (English Edition)
Format:
Paperback
Detalles del producto
Disponibilidad:
En stock
En stock
Peso con empaque:
0.66 kg
0.66 kg
Devolución:
Sí
Sí
Condición
Nuevo
Nuevo
Producto de:
Amazon
Amazon
Viaja desde
USA
USA
Sobre este producto
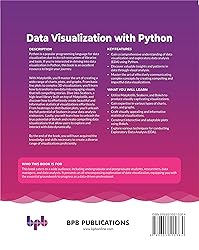
- Transforming data into actionable insights using PythonKey Features● Gain a comprehensive understanding of data visualization and exploratory data analysis (EDA) using Python.● Discover valuable insights and patterns in data through visual analysis.● Master the art of effectively communicating complex concepts by creating compelling and impactful data visualizations.DescriptionPython is a popular programming language for data visualization due to its rich ecosystem of libraries and tools. If you're interested in delving into data visualization in Python, this book is an excellent resource to begin your journey.With Matplotlib, you'll master the art of creating a wide range of charts, plots, and graphs. From basic line plots to complex 3D visualizations, you'll learn how to transform raw data into engaging visuals that tell compelling stories. Dive into Seaborn, a high-level library built on top of Matplotlib, and discover how to effortlessly create beautiful and informative statistical visualizations effortlessly. From heatmaps to distribution plots, you'll unleash the full potential of Seaborn in your data analysis endeavors. Lastly, you will learn how to unleash the true potential of Bokeh and create compelling data visualizations that allow users to explore and interact with data dynamically.By the end of the book, you will have acquired the knowledge and skills necessary to create a diverse range of visualizations proficiently.What you will learn● Utilize Matplotlib, Seaborn, and Bokeh to produce visually captivating visualizations.● Gain expertise in various types of charts, plots, and graphs.● Craft visually appealing and informative statistical visualizations.● Construct interactive and adaptable plots using Bokeh.● Explore various techniques for conducting Exploratory Data Analysis (EDA).Who this book is forThis book caters to a wide audience, including undergraduate and postgraduate students, researchers, data managers, and data analysts. It presents an all-encompassing exploration of data visualization, equipping you with the essential groundwork to progress as a data-driven professional.Table of Contents1. Understanding Data2. Data Visualization – Importance3. Data Visualization Use Cases4. Data Visualization Tools and Techniques5. Data Visualization with Matplotlib6. Data Visualization with Seaborn7. Data Visualization with Bokeh8. Exploratory Data Analysis
U$S 65,89
55% OFF
U$S 29,95
IMPORTÁ FACIL
Comprando este producto podrás descontar el IVA con tu número de RUT
NO CONSUME FRANQUICIA
Si tu carrito tiene solo libros o CD’s, no consume franquicia y podés comprar hasta U$S 1000 al año.
U$S 65,89
55% OFF
U$S 29,95
con envío
Compra protegida
Disfruta de una experiencia de compra segura y confiable
![]() Garantía de entrega
Garantía de entrega
Con Tiendamia todas tus compras cuentan con Garantía de Entrega o devolución total de tu dinero.
Compras 100% seguras y garantizadas, para que pidas lo que soñás y lo recibas del mundo a tu puerta.
Saber más.
Tarjetas prepagas, debito, y credito
Paga hasta en 12 cuotas sin interés con tarjetas de crédito.
Visa
Mastercard
American Express
Dinners
Discover
Lider
Midinero
OCA
OCA Blue
Tarjeta PREX
Pagos a través de PayPal
Paga en dólares con Tarjetas internacionales a través de PayPal.
PayPal